Author Topic: ♥ Daily Infographic (2019) ♥  (Read 16097 times)

Offline MysteRy

  • Global Moderator
  • Classic Member
  • ****
  • Posts: 218357
  • Total likes: 23054
  • Karma: +2/-0
  • Gender: Female
  • ♥♥ Positive Thinking Will Let U Do Everything ♥♥
    • http://friendstamilchat.com/
Re: ♥ Daily Infographic (2019) ♥
« Reply #75 on: May 12, 2019, 10:25:34 PM »
Helpful Tips For Successful Studying

As the dreaded finals season inevitably approaches and teachers dish out the last unit tests, it’s easy to be overwhelmed with how much there is to study. But it doesn’t have to be stressful.   If done properly, this horrific season of living in the library can be manageable. While this infographic goes over all the important tips to help you study effectively, there is one simple piece of advice that I want to focus on. There is no worse feeling than opening your textbook the night before an exam and realizing you actually don’t understand any of the content you’re going to be tested on and that you only have 10 hours to cram four, thirty-paged chapters into your tired brain. (Not speaking from personal experience). This brings me to one of the first and most important rules of studying: do not wait for the last minute to prepare.

We’ve all heard it, and we’ve all decided to ignore it. Sometimes we are successful and manage to ace the test after cramming and only getting two hours of sleep.  Other times we get completely destroyed and vow “Next time for sure! I’ll start preparing earlier”.  No matter what, it’s scientifically proven that we do better after getting lots of sleep and studying over a period of time instead of cramming.


By Tina


Offline MysteRy

  • Global Moderator
  • Classic Member
  • ****
  • Posts: 218357
  • Total likes: 23054
  • Karma: +2/-0
  • Gender: Female
  • ♥♥ Positive Thinking Will Let U Do Everything ♥♥
    • http://friendstamilchat.com/
Re: ♥ Daily Infographic (2019) ♥
« Reply #76 on: May 14, 2019, 08:49:23 PM »
How To Get Rid Of Cable Without Missing Out

If you’ve given up on traditional broadcast television, you’ve truly cut the cord.  But do you fear that you could be missing out? If so, here’s everything you need to know so you’re still up to date with all the shows you love.

Those who chose to stop paying for cable are instead consuming media over the internet with services like Netflix, Hulu, Amazon Prime, and Youtube premium.  It seems like an attractive choice given most of us already pay for several internet subscription services, on top of the traditional cable.

Turns out there is another group out there, the so-called cord-nevers: these are people that never bought commercial cable and instead hopped directly onto the internet wagon.

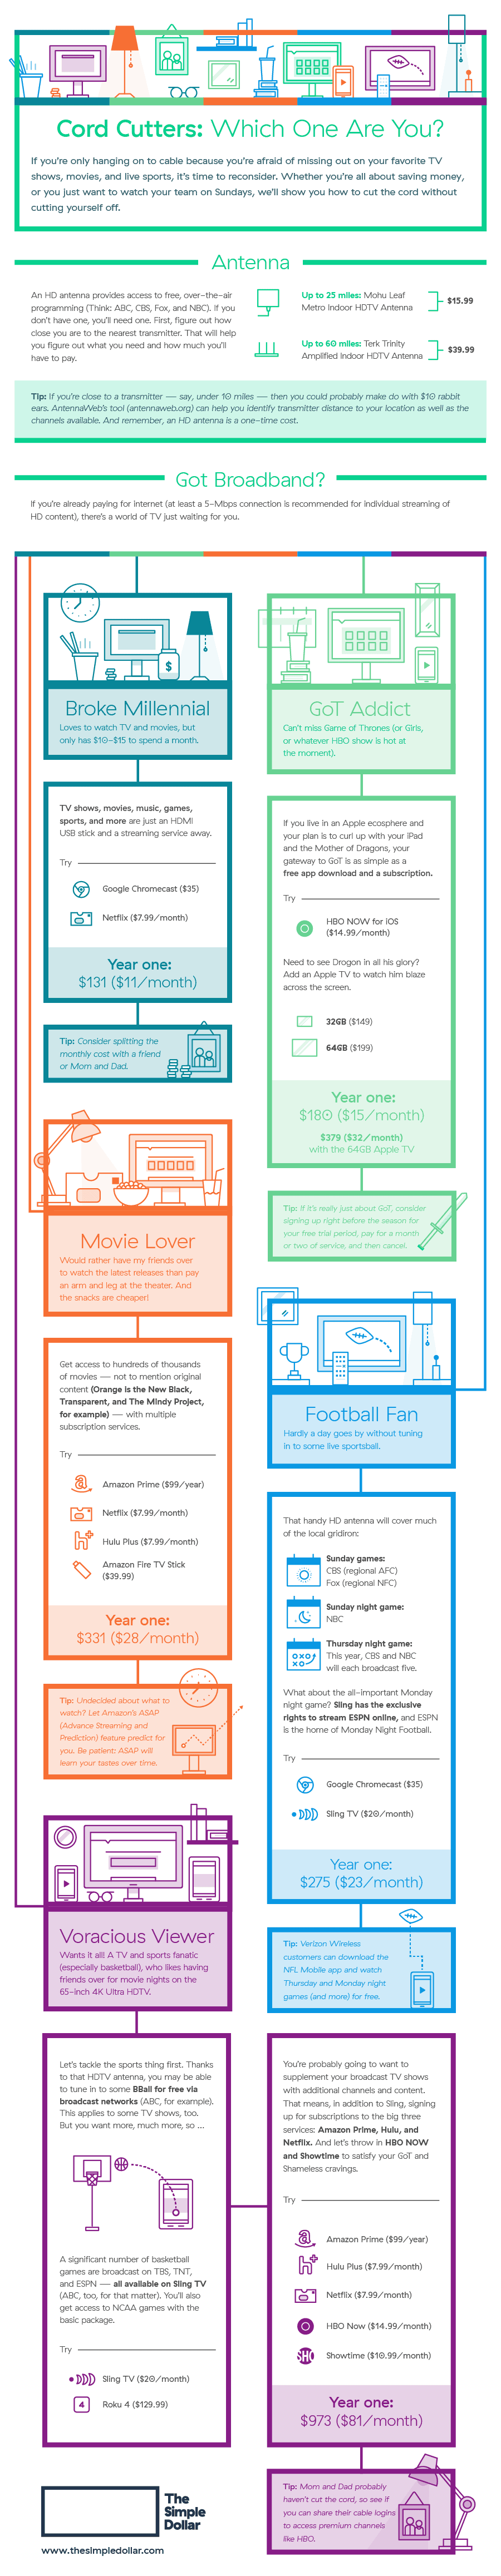
Regardless of where you stand, there are different options for different people. If you’re thinking about letting go of cable, you’ll have to weight the pros and cons of the current streaming options available. There’s no point in signing up for everything and paying for things you won’t watch! To make up your mind, check out today’s infographic. There’s something about every kind of cord-cutter!


By Emily


Offline MysteRy

  • Global Moderator
  • Classic Member
  • ****
  • Posts: 218357
  • Total likes: 23054
  • Karma: +2/-0
  • Gender: Female
  • ♥♥ Positive Thinking Will Let U Do Everything ♥♥
    • http://friendstamilchat.com/
Re: ♥ Daily Infographic (2019) ♥
« Reply #77 on: May 15, 2019, 09:51:51 AM »
The Strategic Role Of The CIO

CIO’s 18th annual State of the CIO(Chief Information officer) survey was conducted with the objective to better understand how the role of the CIO continues to evolve in today’s business climate and to help define the CIO agenda for 2019. The data this year found that CIOs are broadening their strategic role and collaboration with line of business (LOB) to ensure a smooth maturation of digital business transformation – whether it be leading DX initiatives or overseeing tasks that previously were not in their wheel house, such as data and analytics.

This infographic, based on the 2019 State of the CIO research, explores the CIO’s influence, their new responsibilities, and the challenges they expect to experience as their role and the tech landscape evolve. For example, 88% of CIOs say that they are more involved in leading digital transformation initiatives compared to their business counterparts.

Learn more about the research in the 2019 State of the CIO white paper “CIOs Embrace Strategist Charter as Digital Business Matures.”


By May


Offline MysteRy

  • Global Moderator
  • Classic Member
  • ****
  • Posts: 218357
  • Total likes: 23054
  • Karma: +2/-0
  • Gender: Female
  • ♥♥ Positive Thinking Will Let U Do Everything ♥♥
    • http://friendstamilchat.com/
Re: ♥ Daily Infographic (2019) ♥
« Reply #78 on: May 17, 2019, 08:09:08 PM »
How Hot Is The Sun?

Our solar system’s existence is made possible by the hottest star in town:  the Sun. Through its energy, it has been lighting the way for Earthlings to thrive for millions of years.  Although a great ally, we have to keep our distance, because things get pretty hot up there.

As a true star, the Sun is sizzling to the core.  Just like Earth, it has a hot nucleus, where temps can reach upwards of 27 million ºF.  When it comes to size, however, the Sun’s center is around 57 times bigger than that of our planet. 

The next two layers (Radiative and Convective zone) see temperatures cool down to 3.5 million and 10,000ºF.  It’s not beach weather, but certainly a huge drop from the core.

The third layer from the Sun’s nucleus (Photosphere) is the light show that’s visible from our planet.  It’s also the coolest layer at around 10,000ºF. Interestingly, the layers beyond this one (Chromosphere, Transition Zone, Corona) see temperatures increase to about 2.5 million ºF.  Normally, the further we get from a fire, the cooler the temperature. In this case, however, the increase in outer layer temperatures is still a mystery to scientists.

The captain of our Solar System has been a target for exploration for a while.  Luckily, we’re far enough to where we can get away with just a sunburn.


By Ivo


Offline MysteRy

  • Global Moderator
  • Classic Member
  • ****
  • Posts: 218357
  • Total likes: 23054
  • Karma: +2/-0
  • Gender: Female
  • ♥♥ Positive Thinking Will Let U Do Everything ♥♥
    • http://friendstamilchat.com/
Re: ♥ Daily Infographic (2019) ♥
« Reply #79 on: May 19, 2019, 08:58:18 PM »
Holiday Prep For The Workaholic

Some workers pride themselves on being workaholics.  An obsession with work may drive better performance, but wouldn’t a little balance be nice?

Being a workaholic is, more or less, being addicted to work. It can be because you love your job, because you feel obliged to do it or there’s social pressure to be connected to work 24/7 (hello, America!).   Prioritizing work over other things results in poor life balance.

And now, technological developments have made it even easier to be “at the office” when you’re away, whether it’s checking your emails, writing memos, or just stressing about what might be going on while you’re not there. It’s easy to forget to take a break.

If you suspect you might be a workaholic, here’s a handy diagnostic checklist developed by the Department of Psychosocial science at the University of Bergen in Norway:

1. You think about your schedule to try and free more time to work
2. You spend more time working what you initially planned
3. You work as a way to reduce feeling anxious, guilt, depression or helplessness
4. Others have told you to cut down on work (and you haven’t listened)
5. Your stress skyrockets if for some reason you cannot work
6. Work is a priority over exercise, leisure, hobbies and free time
7. Overworking has negatively impacted your health

If you answered “always” or “often” to a majority of these, take a look at your priorities.  You might be a fully-fledged workaholic.  Follow the advice of today’s infographic by letting go of stress and enjoying vacations. If you’re a work addict, why not give it a try?


By Emily


Offline MysteRy

  • Global Moderator
  • Classic Member
  • ****
  • Posts: 218357
  • Total likes: 23054
  • Karma: +2/-0
  • Gender: Female
  • ♥♥ Positive Thinking Will Let U Do Everything ♥♥
    • http://friendstamilchat.com/
Re: ♥ Daily Infographic (2019) ♥
« Reply #80 on: May 21, 2019, 11:06:37 PM »
Here’s The Secret To Keeping Your Customers

One on one conversation is the key to developing any successful relationship.  Despite the growth of online self-help services, 79% of customers still prefer to speak to customer service over a telephone.

Through calls, customers are able to get the information they need clearly and directly. If they have a complaint, they know they are being heard. If they have a question, they are able to ask follow-up questions if the answer is still unclear to them. Calling is a quick and effective way to reach and satisfy consumers. When businesses refuse to talk to their customers, it’s unappealing and shows a lack of care, which can drive them to turn to do business with competitors.

It’s not enough to just have a customer service option, however. The actual service quality must be good. After a poor customer service experience, 89% of customers are more likely to work with a different business. If there are long hold times, or the representative is unable to retrieve account information, customers can get upset which leads to a  costly loss of business. It can be tricky to have good customer service, but with proper training and a clear understanding of how to deal with customers, it is definitely possible.


By Tina


Offline MysteRy

  • Global Moderator
  • Classic Member
  • ****
  • Posts: 218357
  • Total likes: 23054
  • Karma: +2/-0
  • Gender: Female
  • ♥♥ Positive Thinking Will Let U Do Everything ♥♥
    • http://friendstamilchat.com/
Re: ♥ Daily Infographic (2019) ♥
« Reply #81 on: May 22, 2019, 11:14:21 PM »
The Powerful Reach Of Film Franchise Fandom

Do you consider yourself a true fan? Are you an expert in Harry Potter trivia?  Can you recite lines from the Lord Of The Rings books (or movies)?Do you know all the romantic relationships of Marvel’s finest?  If so, you’re one of the millions of hardcore fans around the world.

“Fan” is basically short for fanatic.  Whereas a casual viewer only gets excited by the ‘new and novel,’ true fans stay interested most of the time. They also perform, share and produce content and activities in a community of practices. This community is what’s known as a “fandom” – a blend of ‘fan’ and ‘kingdom’.

The fandom is the universe of interested parties involved, and a strong fandom can make or break a franchise.  In fact, fans don’t limit themselves to only viewing or reading the official materials, they also do a lot of creation by themselves!

Fans make fan art, write fan fiction and reviews, make videos, build websites and engage in passionate conversations in online forums. They have their own vocabulary, known as “fanspeak” and their own dress code, known as “costume” or “cosplay.”  The literature produced by fans is called “fan fiction” and the music is called “filking”.  Fans get together in person in conventions, “fanzines” or other fan-organized meetings.

To foster brand awareness and identity, big franchises ideally collaborate with fans, connecting with a passionate audience that can do enormous marketing on its own.

Today’s infographic is all about fandoms: which fandoms are the strongest, how fans connect and overlap between fandoms, and how these people move millions of dollars every year. Are you part of any fandom?


By Emily


Offline MysteRy

  • Global Moderator
  • Classic Member
  • ****
  • Posts: 218357
  • Total likes: 23054
  • Karma: +2/-0
  • Gender: Female
  • ♥♥ Positive Thinking Will Let U Do Everything ♥♥
    • http://friendstamilchat.com/
Re: ♥ Daily Infographic (2019) ♥
« Reply #82 on: May 23, 2019, 01:31:05 PM »
How To Strategically Catch The Bouquet

If you have been a single lady and attended a wedding, chances are you probably got in line to catch the bouquet. Did you grab it? If not, here’s the ultimate guide to catching the bouquet… without losing your ladylike grace in the process. Are you ready to fight for those flowers?

From courthouse quickies to destination ceremonies, weddings are full of traditions. Between walking down the aisle, keeping the happy couple separated the night before, and the blue-borrowed-new things, it’s a day with quite a few rules. And what better example than the bouquet throwing after the ceremony? If you’re a girl and have ever gone to a wedding, you know what it’s like to be squished between unknown relatives and sweaty friends trying to catch a weirdly-shaped flower arrangement. It’s even weirder when somebody inevitably ends up on the floor (if it’s the booze or their intent to catch the thing, no one really knows).

Either way, do you know how this especially weird tradition came to be? For starters, brides started carrying flowers in Ancient Rome, because it symbolized new beginnings, fidelity, and fertility. Then fast forward to the Middle Ages, when brides added strong-smelling herbs and flowers in order to scare off evil spirits that might bring them unhappiness.

The throwing of the actual bouquet stems from the belief (also from the Middle Ages) that touching any part of the bride’s body or dress would bring good fortune. This became such an extended custom that attendees started ripping off pieces of the bridal gown for “extra good luck”. Apparently, the tossing of the bouquet was ideally conceived as a distraction so brides could escape the ceremony with their dress intact.

The throwing tradition was adopted in the Victorian era in England, where it spread all over the world. Nowadays, it’s only a fun activity for guests to take some priceless pics.


By Emily


Offline MysteRy

  • Global Moderator
  • Classic Member
  • ****
  • Posts: 218357
  • Total likes: 23054
  • Karma: +2/-0
  • Gender: Female
  • ♥♥ Positive Thinking Will Let U Do Everything ♥♥
    • http://friendstamilchat.com/
Re: ♥ Daily Infographic (2019) ♥
« Reply #83 on: May 24, 2019, 08:38:43 PM »
Technology Use In College By The Numbers

Are you a pencil-lover or would you rather take your class notes with a keyboard? Classrooms and computers are more entwined than ever. Today’s infographic is all about the relationship between students and technology.

Technology and innovation has been creeping into the classroom for years now. As more and more people have incorporated the digital world into their lives, it’s only logical that it has also become part of a well-rounded education.

In fact, using online resources and other technologies helps students be more prepared for the digital future.

Pairing up computers with classroom lessons make the latter more understandable and leads to students making better connections with the real world.

Recent studies even show that  technology in the classroom might also help students retain the material better, when compared with traditional textbooks. I think most of us can agree that well-made apps are more engaging than normal books, and considering that the rising costs of college textbooks leading more students to look for online resources, it seems technology in the classroom is our future.

This connects with the next finding: students are more engaged when their education is paired up with technology. This makes for a more fruitful classroom experience and turns education into a group process.

In the end, technology has the ability to make education more accessible, especially in the case of physical or learning disabilities. Nevertheless, it’s always important to keep in mind that computer access isn’t equal among all groups. In this sense, teachers shouldn’t assume their students are privileged enough to have access to a laptop at all times. If you’d like to know more about this, check out today’s infographic!


By Emily


Offline MysteRy

  • Global Moderator
  • Classic Member
  • ****
  • Posts: 218357
  • Total likes: 23054
  • Karma: +2/-0
  • Gender: Female
  • ♥♥ Positive Thinking Will Let U Do Everything ♥♥
    • http://friendstamilchat.com/
Re: ♥ Daily Infographic (2019) ♥
« Reply #84 on: May 27, 2019, 02:00:35 PM »
The Nations That Will Dominate In 2030

The race to the top of the economic food chain has never been more heated.  Currently, nations like the US, China, and Russia seem to be the main players that influence world markets.  But what will things look like in 2030?

The two heavy hitters in global economics are China and the US, with market values of $23.2 trillion and $19.4 trillion respectively.  Today, these bitter rivals engage in frequent exchanges of tariffs that are worth millions. Unfortunately, consumers and small businesses are the ones suffering the consequences.

A country that’s currently on the rise is India.  Its GDP of $9.5 trillion ranks third in the world.  Within the next ten years, experts predict India’s economy to grow by a whopping 387%!  One contributing factor is the nation’s increasing population, which is expected to surpass China’s by 2026.  Population growth may be good for India’s economy, but detrimental to our environment’s well-being.

Egypt is hardly on anyone’s list of economic powerhouses, but that should change soon enough.  Experts are predicting a 587% growth in the next 10 years for this nation.  That means a whopping $7 trillion boost!

Changes are happening all over the globe and new players are taking over the world market.  As more countries’ economies develop, cheaper goods and services become available. Hopefully, a little competition can bring some benefits to the most important player in the game- the consumer.


By Ivo


Offline MysteRy

  • Global Moderator
  • Classic Member
  • ****
  • Posts: 218357
  • Total likes: 23054
  • Karma: +2/-0
  • Gender: Female
  • ♥♥ Positive Thinking Will Let U Do Everything ♥♥
    • http://friendstamilchat.com/
Re: ♥ Daily Infographic (2019) ♥
« Reply #85 on: May 29, 2019, 06:54:33 AM »
Marijuana Laws Across Time And Space

Marijuana- its legalization, its social acceptability, and its health effects- has long been a contentious subject. You’re probably aware that attitudes towards marijuana vary across America, and that’s not only reflected in people’s social customs, but in the legal framework surrounding the drug.


As this infographic shows, there are four ‘types’ of state cannabis programs within the United States: ‘adult and medical use’, ‘comprehensive medical marijuana law’, ‘CBD law/THC product law’, and ‘no marijuana access law’. These provisions range from the most liberal, in states like California, Oregon, and Maine, where weed is essentially legal, to the strictest, in states like South Dakota, Nebraska, and Idaho.

It’s a strange juxtaposition to have such differing legal provisions within one country, and one which is highlighted by an unusual banking practice. While banks now work with marijuana-related businesses, they must still file ‘suspicious activity reports’- over 2,000 of which get filed each month.

Marijuana has had a long and storied history, from its first recorded use in 7,000 B.C. in China, to its federal criminalization in 1937, to California’s passage of Prop 215, legalizing medical marijuana, in 1996. With an estimated 220 million marijuana users worldwide, according to the United Nations, the leafy drug clearly isn’t going anywhere- but it will be a while before Americans agree on what to do about it.


By Irina


Offline MysteRy

  • Global Moderator
  • Classic Member
  • ****
  • Posts: 218357
  • Total likes: 23054
  • Karma: +2/-0
  • Gender: Female
  • ♥♥ Positive Thinking Will Let U Do Everything ♥♥
    • http://friendstamilchat.com/
Re: ♥ Daily Infographic (2019) ♥
« Reply #86 on: May 30, 2019, 01:40:43 PM »
50 Years Of Sesame Street Characters

Learning how to count when we were young was fun and easy, all thanks to Sesame Street.  Having been around for 50 years, it has surpassed the typical TV show life expectancy. Throughout this time, we’ve come to know and love all of its characters.

The first one that probably comes to mind is also the most iconic.  Big Bird has been around from the very first episode, which aired in 1969.  It’s easy to see why, as this fluffy yellow goofball embodies every child with its curiosity.  Bringing positivity every time it appears on screen, the show just wouldn’t be the same without Big Bird.

To balance things out, the creators introduced a character that’s a little less friendly.  Everyone’s favorite grouch that lives in a trash can, Oscar. Every man’s trash is Oscar’s treasure.

One of TV’s favorite bickering couple also lives on Sesame Street.  Originally voiced by Jim Henson and Frank Oz, Bert and Ernie have been getting the best of each other from the very beginning. 

The show has been a household name for a long time.  It’s hard to imagine a world without Sesame Street and all of its unique characters.  Happy 50th anniversary, and here’s to 50 more!


By Ivo


Offline MysteRy

  • Global Moderator
  • Classic Member
  • ****
  • Posts: 218357
  • Total likes: 23054
  • Karma: +2/-0
  • Gender: Female
  • ♥♥ Positive Thinking Will Let U Do Everything ♥♥
    • http://friendstamilchat.com/
Re: ♥ Daily Infographic (2019) ♥
« Reply #87 on: May 31, 2019, 09:03:10 PM »
Why Quora Is The Hottest New Marketing Tool

There are a number of social media options out there to help grow your business. You’ve got Instagram, Snapchat, Facebook, Twitter—but what about the question and answer platform, Quora, as a means of getting the word out there about your organization? Quora may be a way of targeting certain niches and communities by the questions they ask.

The site boasts more than 300 million unique visitors and millions of new questions and answers each month. Thousands of advertisers are already on board promoting their businesses on the platform. Some of the most popular topics on the site include: dating and relationships, entertainment, higher education, business, marketing, travel, and history. Many people on Quora are also talking about fashion and design, politics, science, and health. Some people take to Quora to search topics like learning and shopping.

The infographic also presents some questions that are currently being asked on Quora. One of the most popular questions at 11.3 million views is, “What is the most effective piece of financial advice you’ve ever received?” People looked at the question, “What are the best airport tips?” 8.1 million times on the site, and “What are the best ways to lose weight?” was viewed 8.2 million times.

The ways to market businesses online keeps growing and growing.


By Elyssa


Offline MysteRy

  • Global Moderator
  • Classic Member
  • ****
  • Posts: 218357
  • Total likes: 23054
  • Karma: +2/-0
  • Gender: Female
  • ♥♥ Positive Thinking Will Let U Do Everything ♥♥
    • http://friendstamilchat.com/
Re: ♥ Daily Infographic (2019) ♥
« Reply #88 on: June 01, 2019, 12:53:02 PM »
Visualizing Poverty Across America

Looking at maps can tell you a lot about a country- how people are distributed, or where population growth is concentrated, for example. One of the starkest visuals, though, is a map of hunger and poverty across the United States, as illustrated by SNAP benefits usage.


SNAP, or the Supplemental Nutrition Assistance Program, is the largest federal nutrition assistance program in the United States. Simply put, it provides a monthly supplement for eligible individuals to use on food and groceries, in an effort to combat hunger. Thus, looking at this map of SNAP usage across America offers a good snapshot of poverty and hunger levels across the country.

Regionally speaking, there aren’t too many surprises: as with many other poverty indicators, the greatest hardship is concentrated across Appalachia, the south and southwest, and the Pacific northwest. Other concentrations of hunger occur in urban city centers, such as Cook County, IL, which surrounds Chicago.

However, in Cook County, which encompasses both wealthy and struggling parts of Chicago, 17% of residents use SNAP, while in Shannon, South Dakota, 59% of the population uses food stamps. These numbers suggest that urban poverty may be more localized, confined to small neighborhoods, while rural poverty spreads out over entire states and regions. Either way, seeing the geographical scope of hunger is a necessary first step in order to find solutions that work.


By Irina


Offline MysteRy

  • Global Moderator
  • Classic Member
  • ****
  • Posts: 218357
  • Total likes: 23054
  • Karma: +2/-0
  • Gender: Female
  • ♥♥ Positive Thinking Will Let U Do Everything ♥♥
    • http://friendstamilchat.com/
Re: ♥ Daily Infographic (2019) ♥
« Reply #89 on: June 02, 2019, 08:01:30 AM »
The Far Reaching Impact Of AI

It’s difficult to deny the positive change technology has brought to us. From living longer thanks to antibiotics to talking with people all over the world and getting to know other cultures with just the click of a button, technology has the ability to bring us closer.

On the business side of things, technology increases productivity and operational capacity. The ultimate technology trend is machine learning and AI.  Short for artificial intelligence, AI automates processes and substitutes roles that were previously performed by humans. From selecting the best pictures to harvesting fruit and even doing surgery, AI has meddled in pretty much every aspect of our lives.

Nevertheless, everything isn’t all rainbows and unicorns when it comes to AI. Even Elon Musk says we should be worried. For starters, AI is supposed to be trained using “unbiased algorithms,” but the reality isn’t so simple. Developers are people, so the data they collect is based on a set of parameters given by their own world vision. By training AI with this set of values, their calculations, data and actions will follow our particular vision of the world –racist, sexist and class-based.

Like it or not, artificial intelligence is here to stay. In fact, apparently, AI is likely to dominate the corporate world within a few years.

AI can be troublesome when it comes to unemployment, given that technology is being created in order to reduce costs (AKA lowering salaries).  It’s an unmistakeable trend that none of us are likely to miss.


By Emily